Sales Heat Maps

Knowing which market area you have a larger or smaller share in, can be

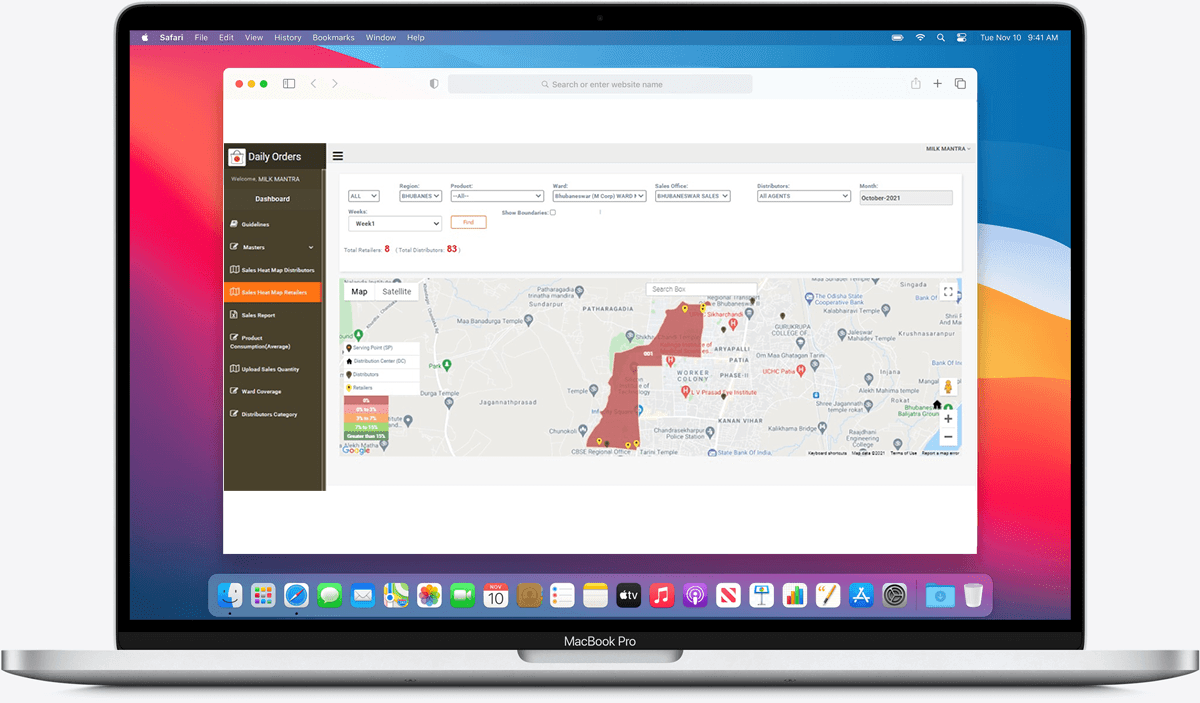
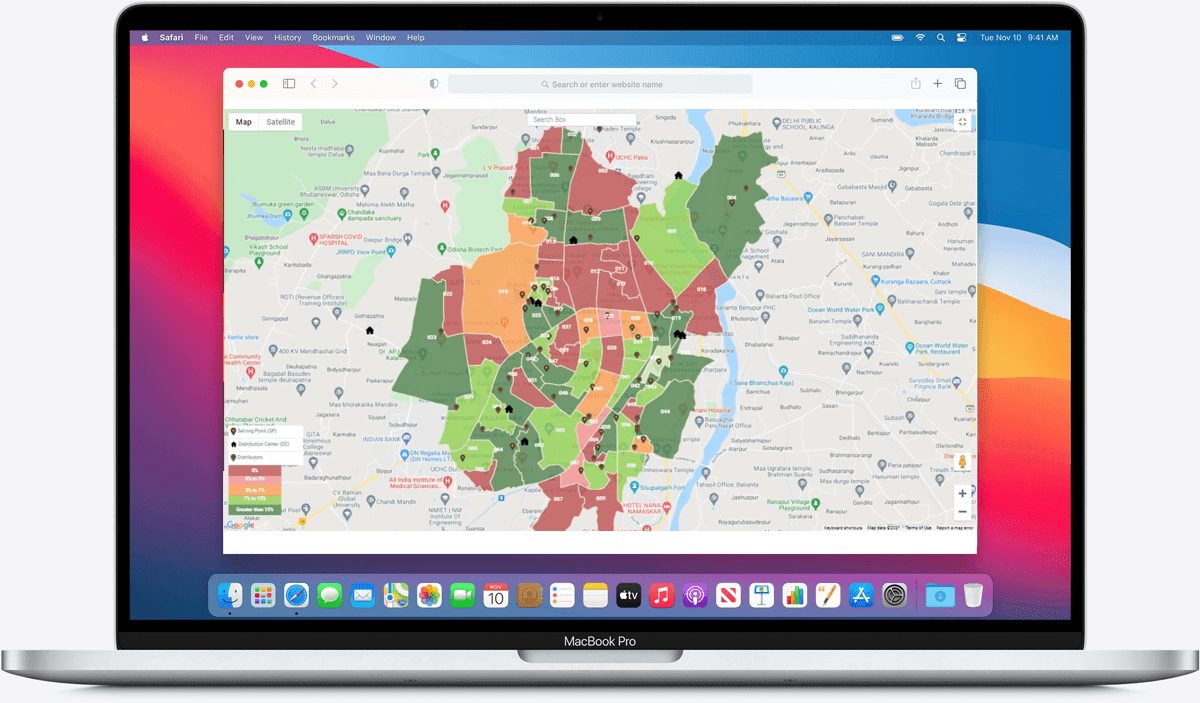
Track Sales Performance Seamlessly

Sales Heat Maps is one of the most useful and unique offerings that Vasista provides its customers. After gathering data from the municipal corporation about the number of households present in a location and other demographics, an interactive map of the dairy company’s market share is created. This sales heat map shows the areas where the company is struggling to get a significant market share in red, the areas where it has the upper hand in green, and areas where they need to improve their efforts in orange.
It is a powerful tool that provides sales performance analytics on an area wise, route wise, or region wise basis allowing sales managers to make better decisions to increase sales. It can show the revenue generated and the contribution of every product in different regions and helps cope up with changing customer demands with a seasonal fluctuation chart.

Interactive Graphics for Easy Understanding

Depicting these details in the form of a graphic makes it easier for the sales team to plan market strategies to either increase supply to a certain area or curb all efforts to prevent incurring a loss. They get a clear view of the whole town or locality and know exactly where people like their milk and where their competitors are favoured. There is also a provision to add competitor data and compare the performance of year-on-year sales or customer distribution on a granular basis.

Efficiently Plan Sales and Distribution

Apart from competitor comparison, the sales heat map allows executives to keep an eye on their distributor and agent performance. They can figure out which distributor is working below its capacity and which distributor can expand, given the number of households available in that locality. This allows dairy companies to plan their distributor network efficiently by aligning a small distributor with a region where there are only 10 households instead of aligning it with a bigger location where it cannot fulfil the demand.

Plan for Expansion and the Future

Sales heat maps provide an insight into the spreadability of the dairy company as well. By analyzing the number of households and the average consumption of milk in that area, it provides data on what the potential spread of the company could be. This makes it easier for sales executives to decide where to improve their efforts for closing more deals and increasing their market share. Through the visual representation of sales data available at distributor and retailer levels, companies can easily identify areas of inefficiencies and take corrective actions to improve their market share.

Case Study

BRAC Dairy and Food Project was the first dairy company in Bangladesh to receive the ISO 22000 certification. When it first started, BRAC was producing 140,000 litres of milk every day. They were having difficulties in managing different manual tasks and had to do a lot of reworks. There was an unavailability of accurate as well as real-time data which was hampering their progress.

By implementing Vasista’s off-the-shelf ERP Milkosoft, BRAC was able to automate their entire supply chain. They reduced the amount of rework to be done and aligned with the best industry practices to increase production. Availability of real-time data and reports gave them more control over the business processes. Now BRAC operates 101 chilling centres and processes 250,000 litres of milk every day. It has more than 50,000 registered farmers and 1500 employees working in 101 chilling centres and processing 250,000 liters of milk per day.

The Future of Your Dairy is Just a Call Away

Our in-house ERP Milkosoft is used by renowned Dairies across the country. Our unique products, domain knowledge, and commitment to details help transform your dairy operations.

Get the latest update on Dairy Management